Build your home gym with better data.
We turn technical specifications, price and practical buying factors into clear comparisons — so you can choose equipment with confidence, not guesswork.
Shop smarter by category
Start with the equipment that matters to your setup.
Treadmills
Performance, running area, incline, cushioning, footprint and value.
Compare treadmills →Exercise bikes
Resistance, ride feel, adjustability, noise, stability and connectivity.
Explore bikes →Rowing machines
Stroke quality, resistance, storage, build, console features and value.
Explore rowers →Adjustable dumbbells
Weight range, increments, change speed, durability and space efficiency.
Explore dumbbells →Benches
Stability, load rating, adjustment range, pad quality, storage and value.
Explore benches →Cable & multi-gyms
Exercise versatility, resistance, smoothness, footprint and build quality.
Explore strength →Nutrition, compared with the same discipline.
Protein powders, bars and ready-to-drink shakes with verified nutrition data and a separate Protein Value Score built for nutrition — not equipment.
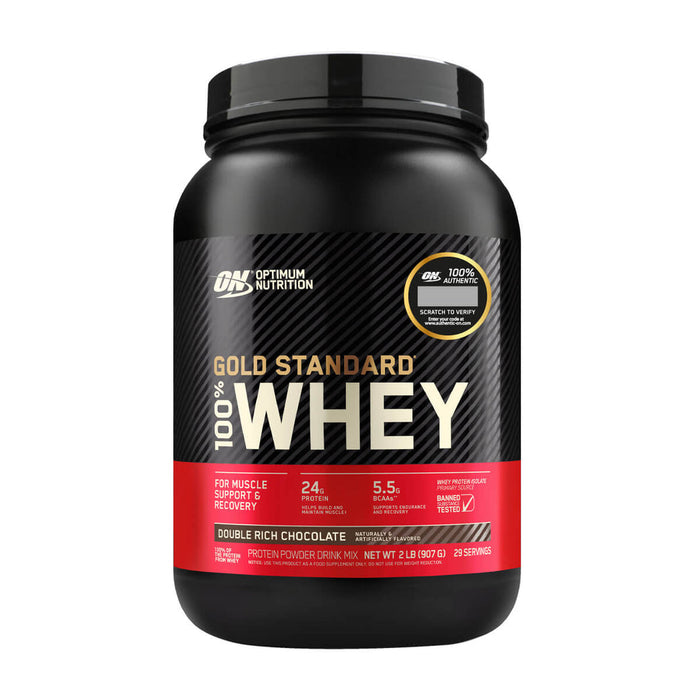
Protein Powders
Compare protein per serving, calories, sugar, serving size and value.
Explore protein powders →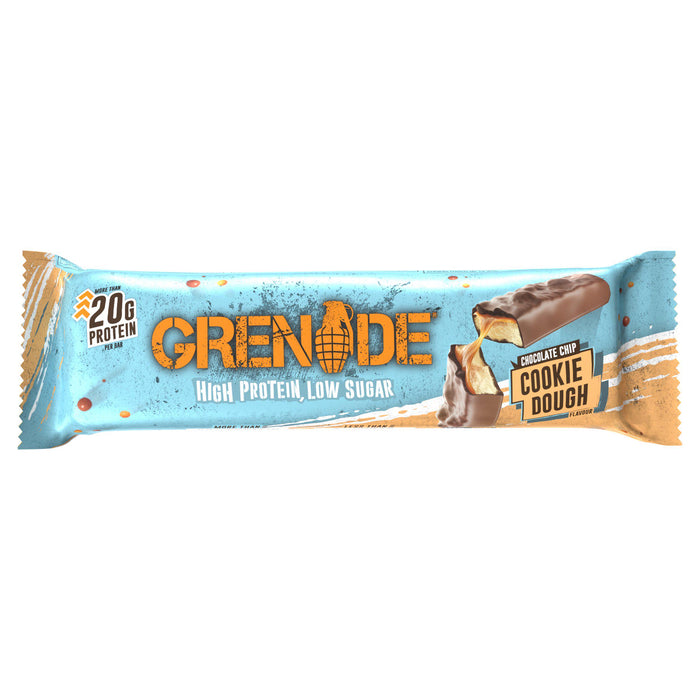
Protein Bars
See protein, calories, sugar and serving data side by side.
Explore protein bars →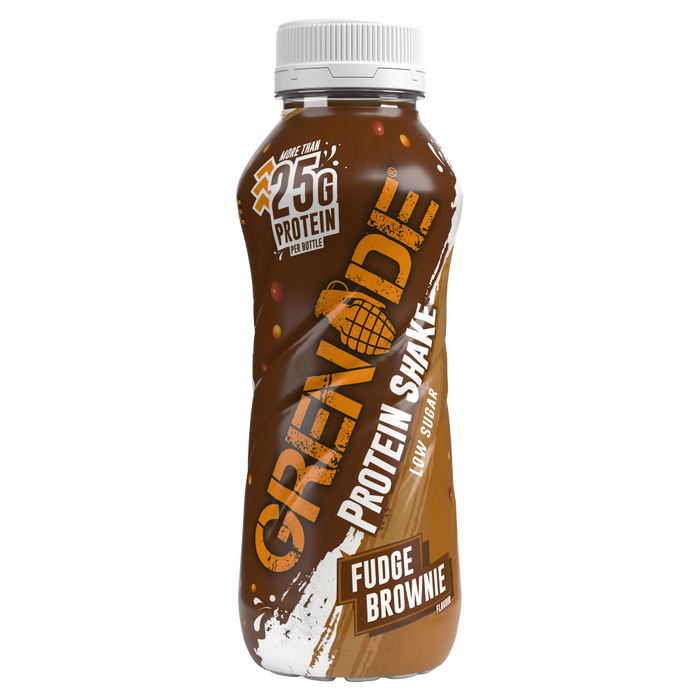
Protein Shakes
Compare ready-to-drink shakes by protein, calories, sugar and bottle size.
Explore protein shakes →A score you can actually understand.
The Verity Score summarises the factors that matter for each equipment category. Raw specifications stay visible beside the score, while weighted criteria make comparisons faster. We only score factors for which we have defensible evidence.
Illustrative scoring framework shown here. Live product scores will be calculated from verified source data.
See the trade-offs instantly.
A radar chart gives a fast visual summary across the factors that matter most. It never replaces the raw specifications: the chart and spec table work together, so a strong-looking shape can always be checked against the underlying numbers.
Example only. Scores below are placeholders used to demonstrate the comparison interface.
Side-by-side, without the noise.
Important differences should be obvious in seconds.
| Factor | Model A | Model B | Model C |
|---|---|---|---|
| Verity Score | 8.6 | 8.2 | 7.9 |
| Best for | All-round use | Small spaces | Value |
| Performance | 9.0 | 8.0 | 7.8 |
| Space efficiency | 7.8 | 9.2 | 8.1 |
| Value | 8.4 | 7.8 | 9.0 |
| Data confidence | High | High | Medium |
Less marketing noise. More useful evidence.
Our goal is simple: help UK home-gym buyers understand what they are paying for before they click buy.


